
Aspire Dashboard
In a previous post, we explored how Aspire simplifies .NET development by managing dependencies and enhancing productivity. Today, we will delve into the Aspire Dashboard, a powerful tool that provides insights into your .NET projects.
What is the Aspire Dashboard?
The Aspire Dashboard is a web-based interface that allows developers to monitor and manage their .NET projects. It provides a comprehensive overview of your projects, including their status, dependencies, and performance metrics. The dashboard is designed to help you quickly identify issues and optimize your development workflow.
The dashboard is available once you start the AppHost project in your solution. For this post, we will use the sample project from the Simplify Your .NET Development with Aspire post which is available on GitHub
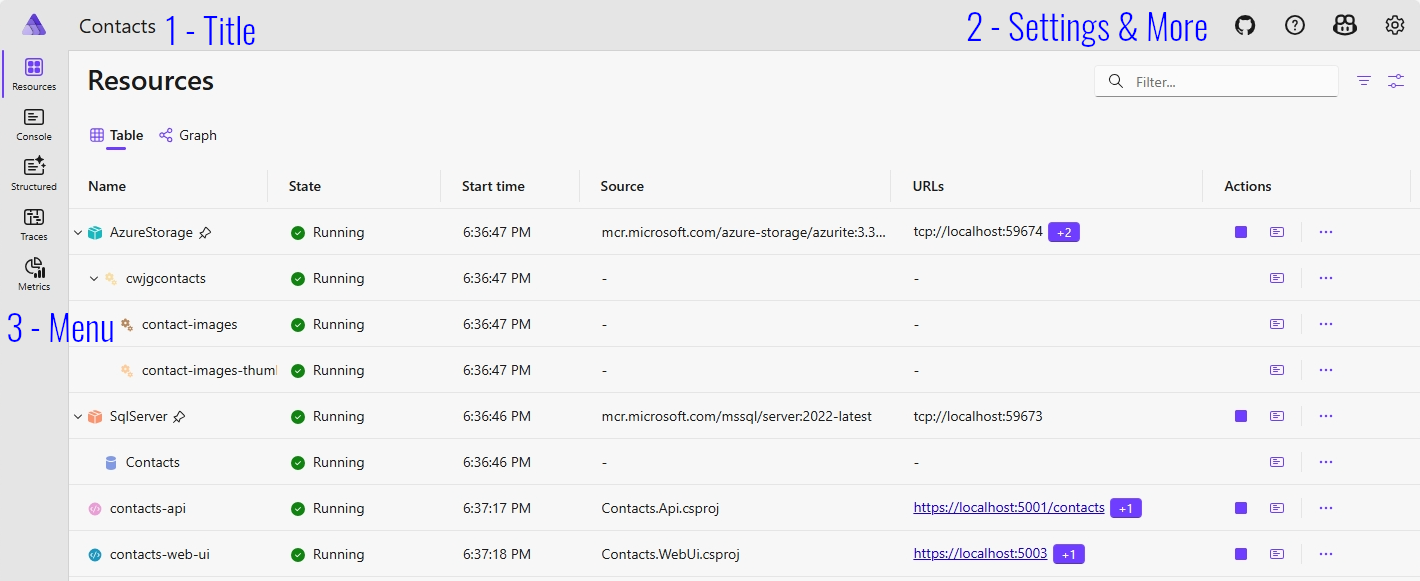
Once we start the AppHost project, Aspire will launch the Aspire dashboard in the browser as well as other projects that are part of the solution. In this case, the Contacts.Api and Contacts.Web projects will be launched. The Aspire dashboard should look similar to the following image:
Exploring the Dashboard
The Aspire Dashboard is divided into several sections, each providing different pieces of information about your projects:
-
1 - Title Bar: Displays the name of the project. This currently is the name of the AppHost project, less the
.AppHostsuffix. In this case, it is Contacts. - 2 - Settings & More: This section provides access to dashboard settings and more options.
- 3 - Menu: Contains links to various sections of the dashboard, such as resources, dependencies, and performance metrics.
Let’s explore each section in more detail.
1. Title Bar
The title bar displays the name of the project. This is useful for quickly identifying which project you are currently viewing in the dashboard. Not much more to say about this section.
2. Settings & More
This section provides access to various settings and options for the dashboard.
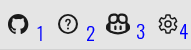
The GitHub icon (#1) allows you to view the source code for Aspire on GitHub.
The Help icon (#2) provides a list of the available keyboard shortcuts for navigating the dashboard. This is useful for power users who prefer to use keyboard shortcuts instead of the mouse. It also provides a link to the Aspire documentation. Not that you will need it after this post. ![]()
The GitHub Copilot icon (#3) starts up a GitHub Copilot chat session that lets you diagnose issues with your application. Summarize the application and it’s dependencies, and ask questions about the application. This is a great way to get help with your project without leaving the dashboard. Unfortunately, this feature requires that you have a GitHub Copilot subscription, as well as start the application from Visual Studio 14.14 or later or VS Code with the C# Dev Kit 1.19.63 or later.
The Settings icon (#4) allows you to configure various settings for the dashboard, such as theme and language. You can also delete all of the local telemetry that has been gathered through Aspire.
3. Menu
The menu section contains links to various sections of the dashboard. This is probably the most important section of the dashboard, as it provides access to all of the features and functionality of Aspire. You’ll spend a lot of time clicking around in this section or using the keyboard shortcuts to navigate.
The “menu” section contains links to the following sections:
- Resources: This section provides an overview of the resources used by your project, such as databases, APIs, and other external dependencies.
- Console: This section allows you to view the console logs for different resources in your project.
- Structured: This section allows you to view structured logs for your project, if you have a structured logging provider configured in your project, such as Serilog.
- Traces: This section allows you to view traces for your project, which correlate log events that are part of the same logical activity, even if they’re spread across multiple machines or processes.
- Metrics: This section allows you to view performance and health metrics for your project, such as response times, error rates, and other key performance indicators.
Let’s dig more into this menu.
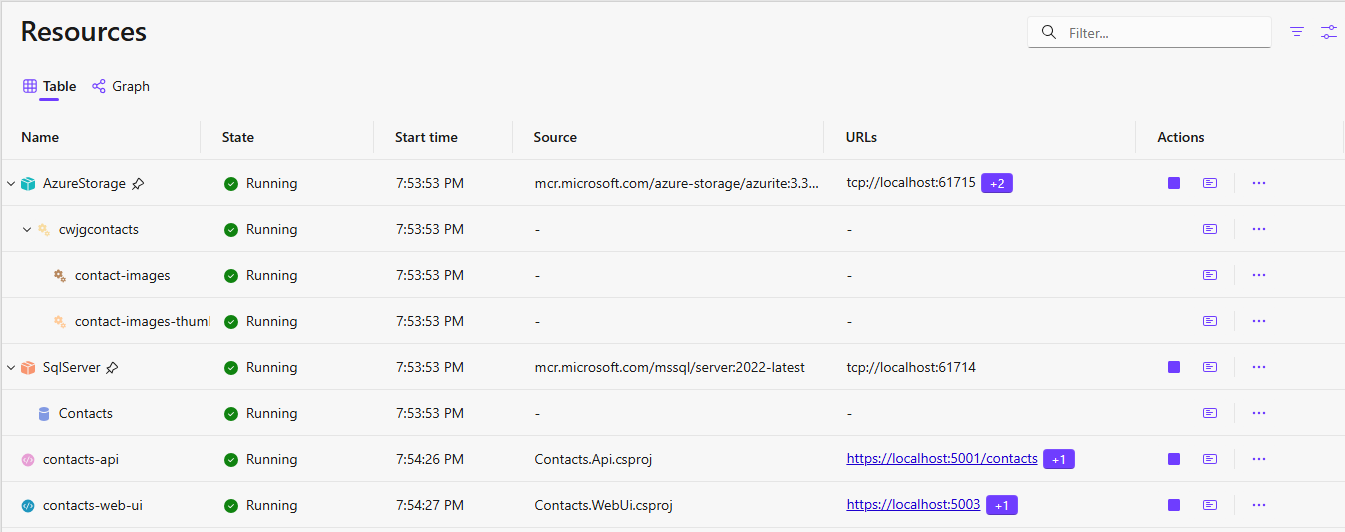
Resources
The Resources section provides an overview of the resources/dependencies used by your project. You can think of this as a list of all of the “things” that make up your project, such as databases, APIs, web services, and other external dependencies.
This section is broken down into two parts, or views: the Table view and the Graph view.
Table View
The Table view displays a list of all the resources used by your project in a tabular format. This view is useful for quickly identifying the resources and their status. You can also filter the resources by type, status, and other criteria, start/stop the resource, and view the details of each resource.
Filtering Resources
In the filter text box, upper right hand corner, you can filter the resources by name. For example, if you type “sql” in the filter text box, the table will only show resources that contain “sql” in their name. The button to the right of the filter allows you to filter by resource type, such as SQL Server, Redis, or RabbitMQ. This is useful for quickly finding the resources you are interested in. The second button to the right of the filter allows for to customize what is visible to the current view, like the resource type or child dependencies.
Resource Details
The resource table displays the following information for each resource:
-
Name: The name of the resource. This is the name of the resource as you defined it in your project. The name column can also contain child resources. In this example, the AzureStorage resource has a child resource
cwjgcontactswhich is a storage name in the Azure Storage account, which has two child resources,contact-imagesandcontact-images-thumbnails, which are the containers in the Azure Storage account. -
State: The current state of the resource.
- This can be Running, Unhealthy, Error, or Stopped.
- Running means the resource is up and running.
- Unhealthy generally means the resource is starting up, but not yet ready to accept requests.
- Error means there was an issue starting the resource.
- Stopped means the resource is not running.
- This can be Running, Unhealthy, Error, or Stopped.
- Start Time: The time the resource was started.
- Source: The source of the resource, such as a Docker image, a local project file, or something else.
- URLs: The URL(s) associated with the resource. You can click on the URL to open up the resource, like a web service or API, in a new tab in your browser.
- Actions: The actions you can take on the resource, such as starting or stopping the resource. You can also view the details of the resource by clicking on the “View Details” link.
Actions
The actions column provides quick access to common actions that you can take on the resource. You can start or stop the resource, view the details of the resource, or view the logs for the resource.
The stop icon  will stop the resource.
The console logs icon
will stop the resource.
The console logs icon  will open the console logs for the resource in a new tab in your browser.
The ellipsis icon
will open the console logs for the resource in a new tab in your browser.
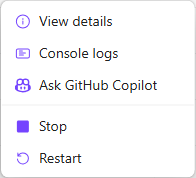
The ellipsis icon  will open the details for the resource in a new tab in your browser. Clicking on the ellipsis icon will bring up the actions menu. The actions menu will vary depending on the type of resource, but generally includes options to view the details of the resource, view the console logs, Ask GitHub Copilot, start, and stop the resource.
View Details
The View Details option will give you more information about the resource, such as the configuration, environment variables, and other details. In the screen shot below, you can see some of the details for the Contacts.Web resource.
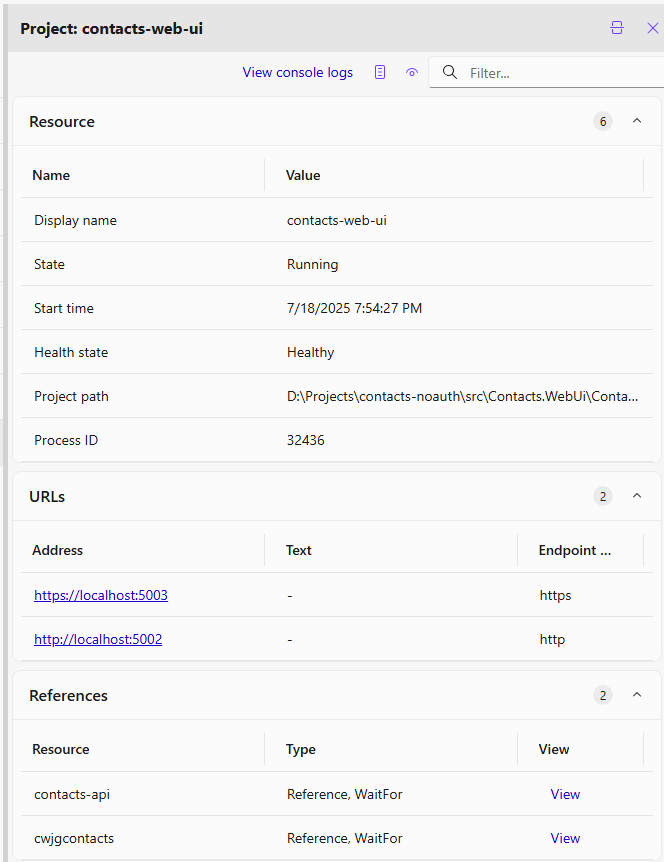
Here you will find the following information:
- Resource Information: The name, type, state of the resource, and more.
- URLs: The URLs associated with the resource. You can click on the URL to open up the resource in a new tab in your browser.
- References: The references to other resources that this resource depends on. This is useful for understanding the relationships between resources in your project.
Not shown in the screen shot above, but you can also view the back reference, health checks, and environment variables for the resource. The back reference shows you which resources depend on this resource, while the health checks show you the health of the resource. The environment variables show you the environment variables that are set for the resource.
Again, the information displayed will vary depending on the type of resource. For example, a SQL Server resource will have different information than a Redis resource.
Graph View
The Graph view displays the resources in a graphical format, showing the relationships between the resources. This view is useful for understanding the dependencies between resources and how they interact with each other.
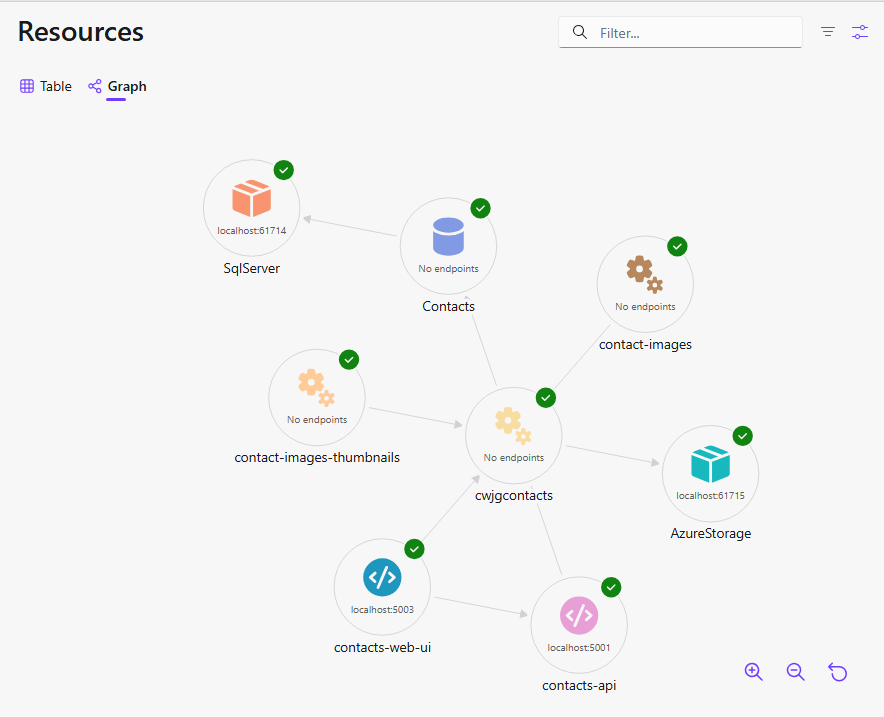
The status of the resource can be identified by the icon in the upper right hand corner of the resource node. Hovering over the resource will show you which way the dependency flows, such as Inbound or Outbound. Clicking on the resource will show you the details of the resource in a side panel, similar to the clicking the ellipsis and selecting View Details in the Table view.
Console
In the Console section, you can view the console logs for different resources in your project.
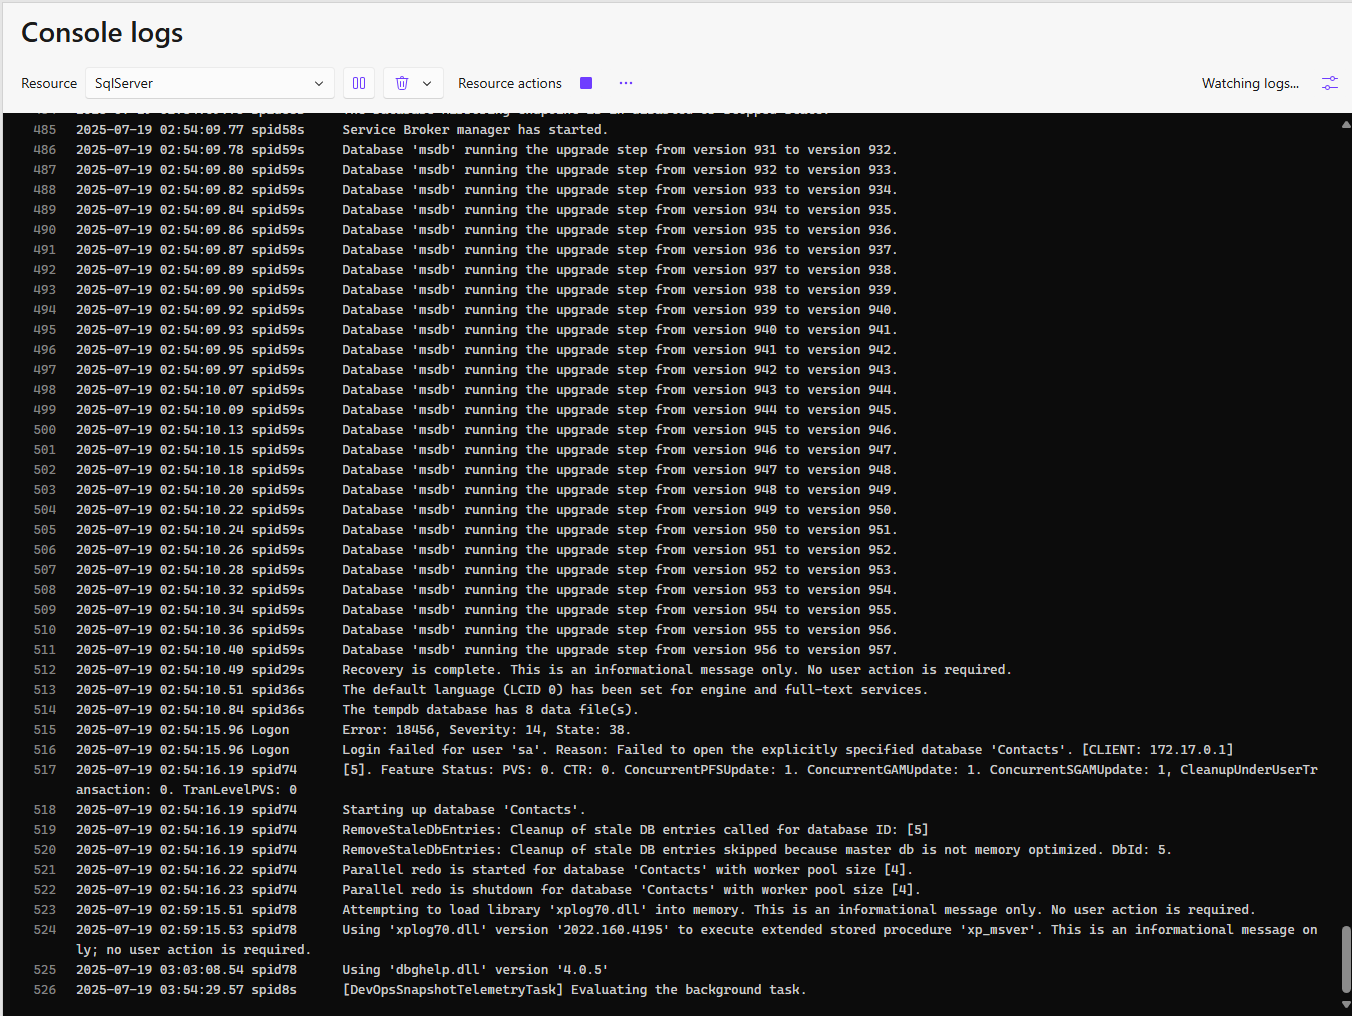
In the screen shot above, you can see the console logs for the SQL Server resource. In the top part of this section, you can select the resource you want to view the logs for. You can also pause the logs, or delete the logs for this resource or any of the resources in you project. You also can perform different actions on the resource, such as starting or stopping the resource, or viewing the details of the resource.
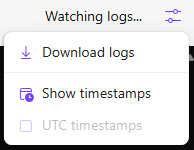
In the upper right hand corner, to the right of the Watching logs… text, you can click on the “Console Log Settings” icon to either download the logs or show the timestamps for each log entry.
Structured
In the Structured section, you can view structured logs for your project. This only works if you have a structured logging provider configured in your project, such as Serilog. This section provides a way to view the structured logs in a more readable format.
This project does not have a structured logging provider. The screen shot below is from a different project that has Serilog configured.
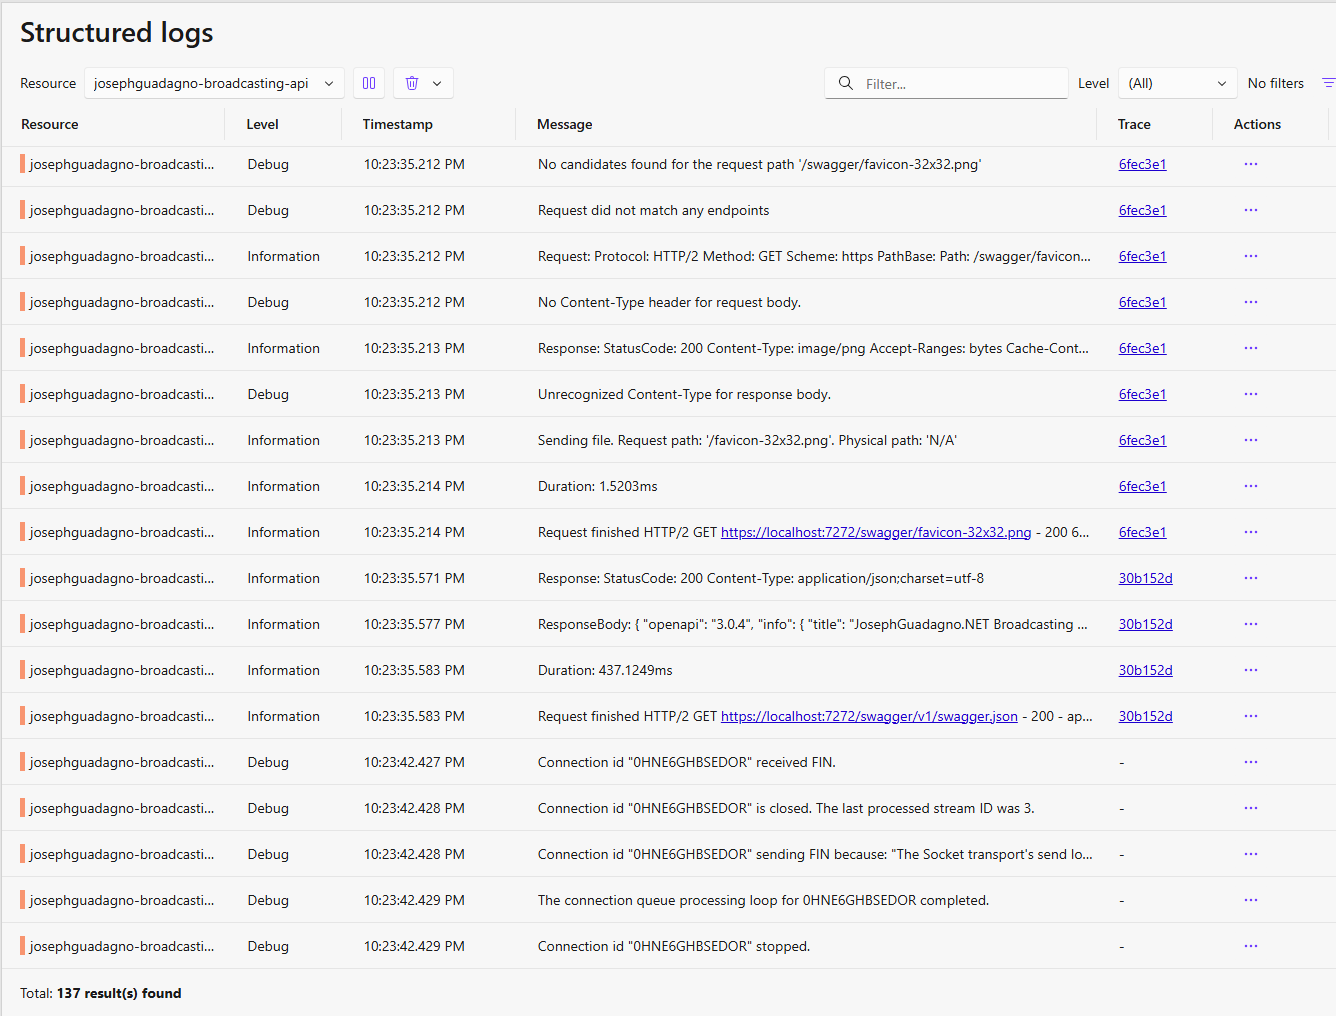
Similar to the Console section, you can select the resource you want to view the logs for, pause the logs, or delete the logs for this resource or any of the resources in your project. You can also perform different actions on the resource, such as starting or stopping the resource, or viewing the details of the resource. However, since this is structured logging, you can also filter the logs by level, such as Information, Warning, Error, or Critical. You can also search for specific text in the logs.
You will see that there are several columns in the structured log view:
- Resource: The name of the resource that generated the log entry.
- Level: The level of the log entry, such as Information, Warning, Error, or Critical.
- Message: The message of the log entry.
- Timestamp: The timestamp of the log entry.
- Trace: The trace ID associated with the log entry. This is useful for correlating logs across different resources in your project.
- Actions: The actions you can take on the log entry, such as viewing the details of the resource or copying the log entry to the clipboard.
The actions ellipsis icon will open the actions menu, you can:
- View Details: which allows you to view the details of the message, it provides more details about the log entry, very similar to the Application Insights interface on the Azure portal.
- Log Message: which allows you to copy the log message to the clipboard or view the log message in different formats, such as JSON or XML.
- Ask GitHub Copilot: which allows you to ask GitHub Copilot about the log entry.
Traces
Traces correlate log events that are part of the same logical activity (e.g. the handling of a single request), even if they’re spread across multiple machines or processes.
In this section, you can view the traces for your project. This is useful for understanding the flow of requests through your application and how they interact with different resources. You can filter the traces by resource, status, and other criteria.
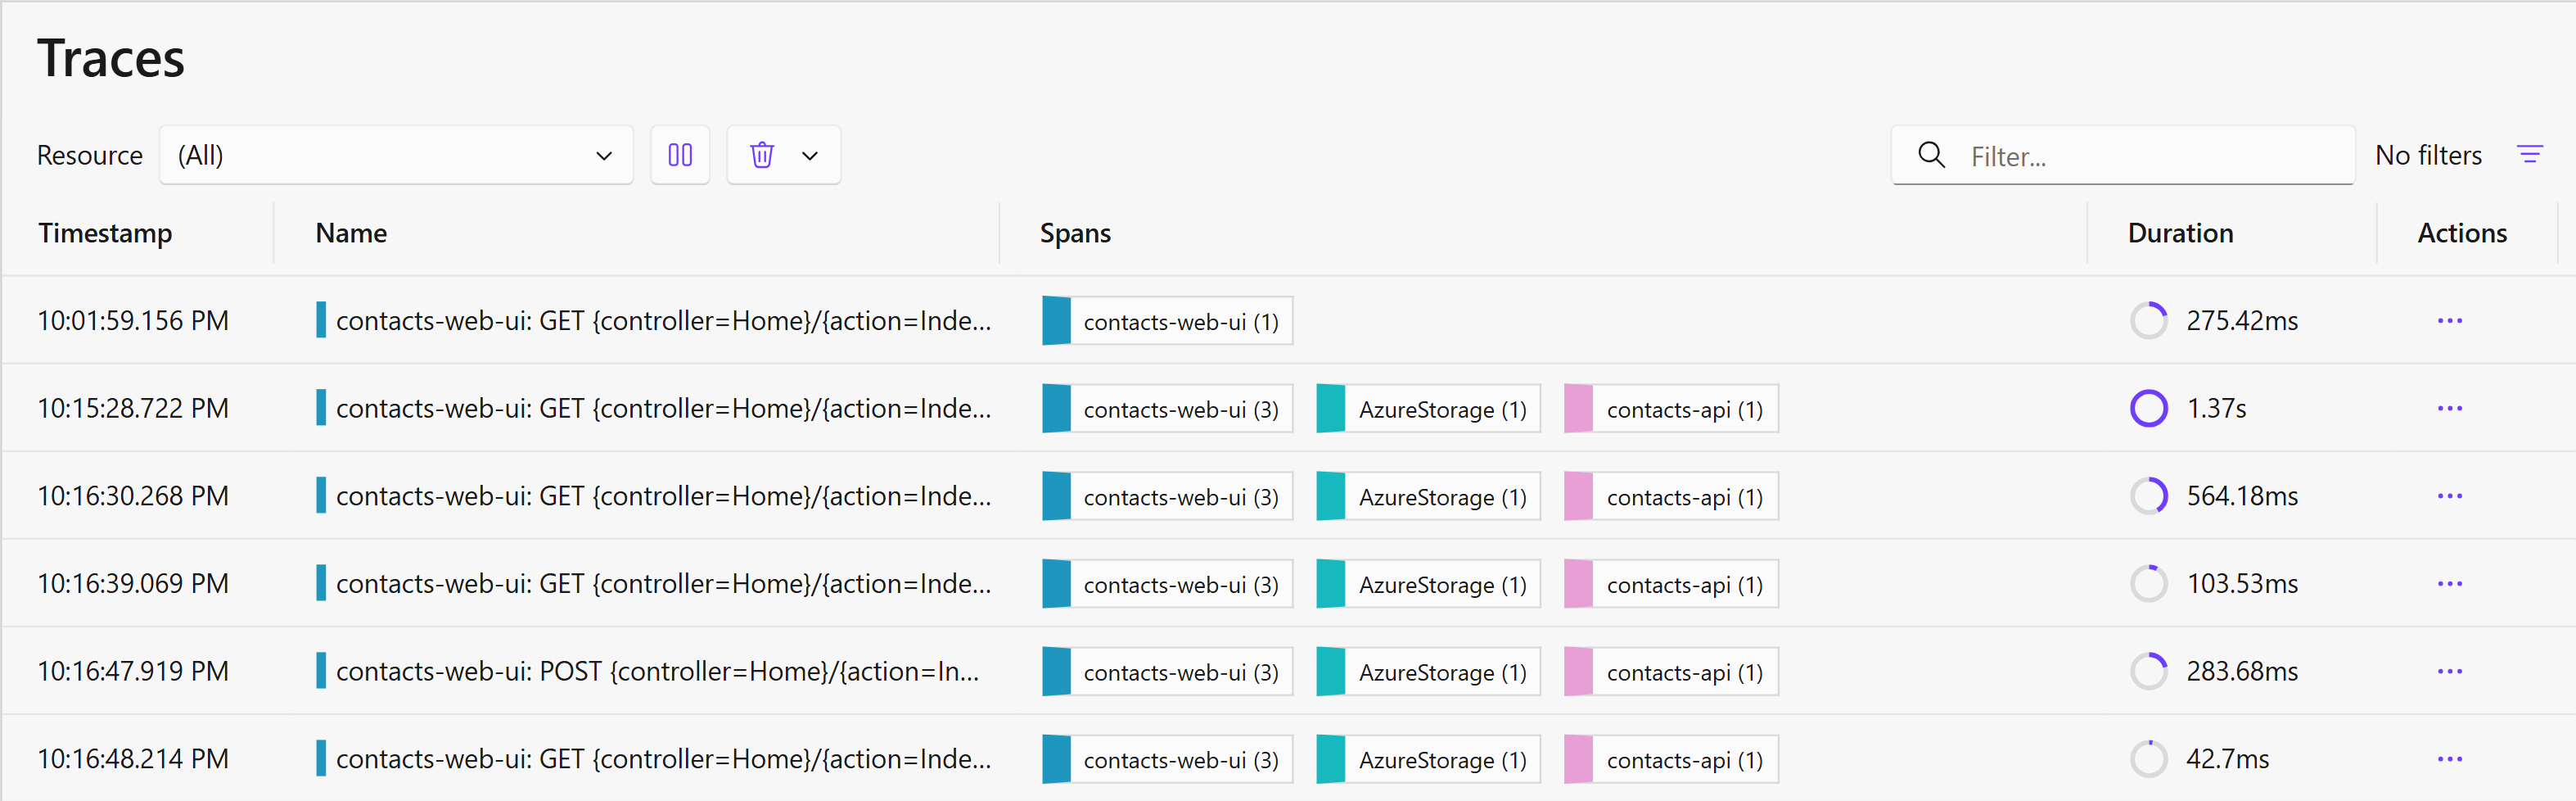
Here you will see that Aspire captured six traces for the Contacts.Web resource and are grouped by a common trace ID. The trace ID is a unique identifier for the trace, and it is not shown in the screen shot above. In this view, you can see the following information:
- Timestamp: When the first log entry was captured for the trace.
- Name: The name of the trace, which is the name of the resource and an action that generated the trace.
- Spans: All of the the different resources, and their count of log entries, that were part of the trace.
- Duration: The total duration of the trace, which is the time between the first and last log entry in the trace.
- Actions: The actions you can take on the trace, such as viewing the details of the trace or copying
For the actions, you can click on the ellipsis icon to view the actions menu. The actions menu will allow you to:
- View Details: which allows you to view the details of the trace, including the log entries that are part of the trace.
- Structured Log: which allows you to view the structured logs for the trace.
- Ask GitHub Copilot: which allows you to ask GitHub Copilot about the trace.
If you click on one of the traces, you will see the details of the trace.
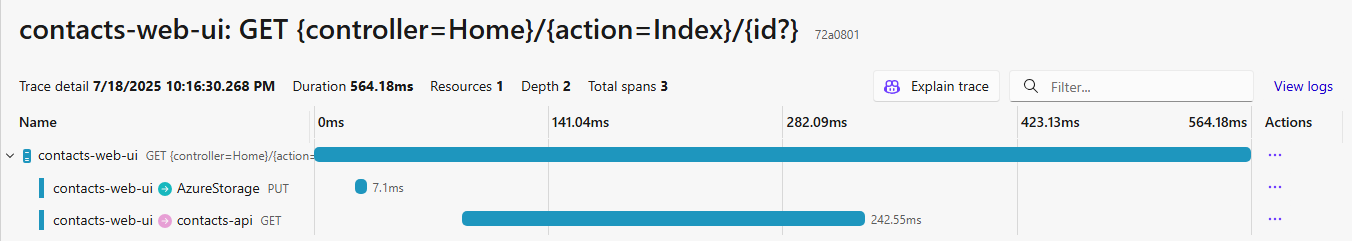
In this view, you will see details about the trace, such as the trace ID, the timestamp, the duration, and the spans that are part of the trace. You can also see the log entries that are part of the trace, which are ordered in the order they happened.
In the screen shot above, you can see that the trace is made up of three spans, which are the Contacts.Web, the initiator of the trace, a PUT call to Azure Storage, and then a GET call to the Contacts.Api resources. This is useful for understanding the flow of requests through your application and how they interact with different resources as well as the time it took to complete each portion of the flow.
Metrics
Metrics expose the performance and health characteristics of an app as simple numerical values. As a result, they have low performance overhead and many services configure them as always-on telemetry. This also makes them suitable for triggering alerts when potential problems are detected.
In this section, you can view the metrics for your project. You can filter the metrics by resource and the time duration. Example: the last minute, last five minutes, last hour, or last 12 hours. You can also view the metrics in a graphical format, which is useful for understanding the performance and health of your application.
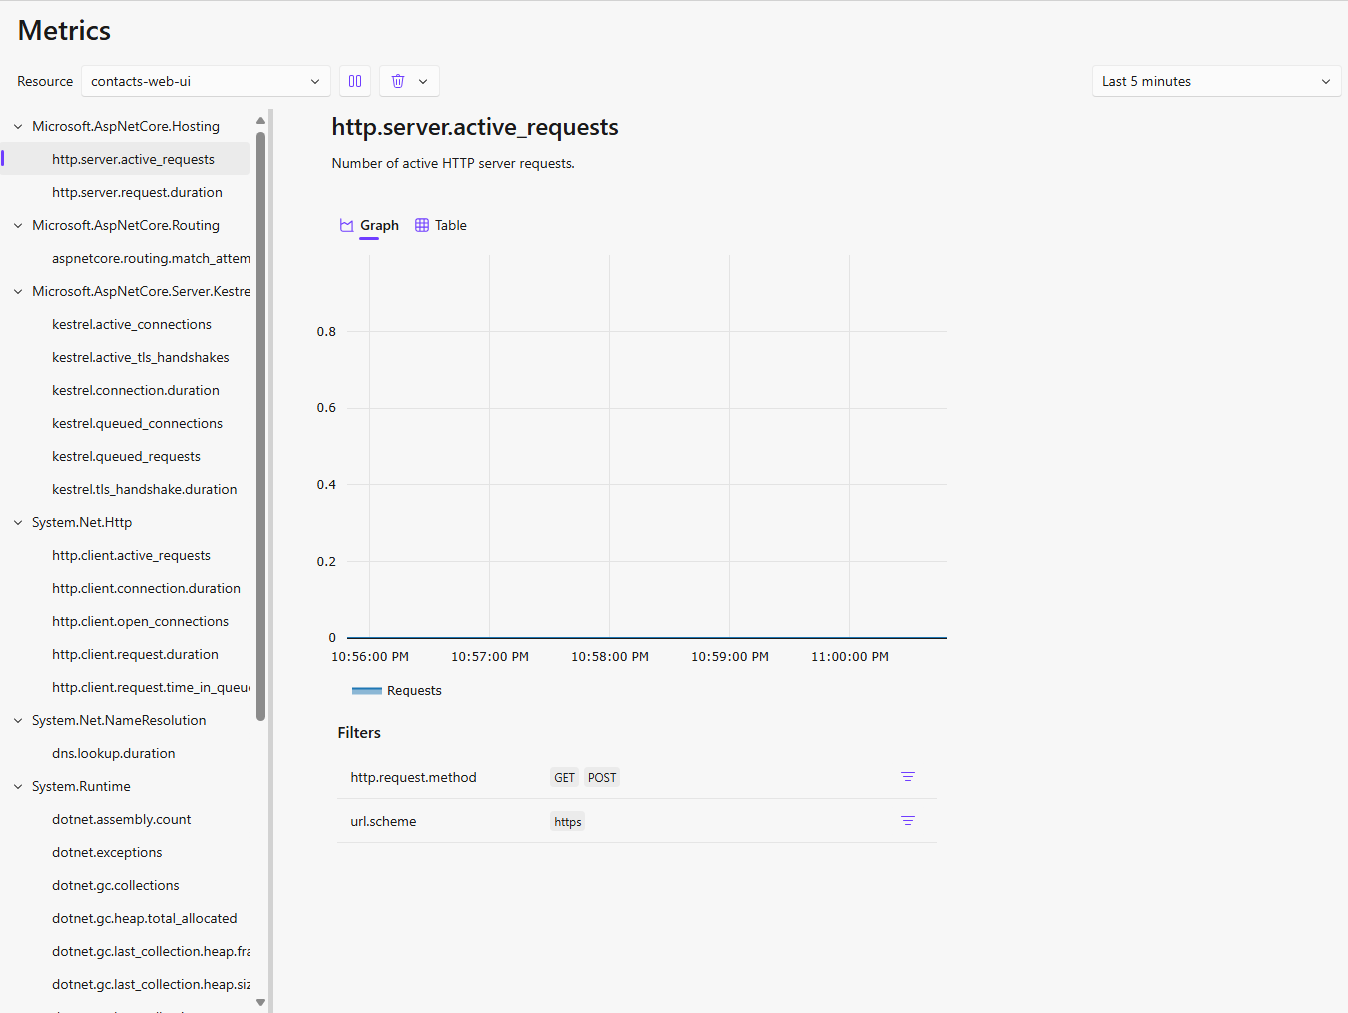
On the left side of the screen, you can see the list of metrics that are available for your project. You can select the metric you want to view, grouped by the metric collector, such as Microsoft.AspNetCore.Hosting, Microsoft.AspNetCore.Routing, and others. The right side of the screen shows the graph or table for the selected metric. Depending on the metric chosen, you can several data points, such as the number of requests, the response time, and the number of errors. There are also several filters available to help you narrow down the metrics you want to view.
In the screen shot above we are looking at the Microsoft.AspNetCore.Hosting - http.server.active_requests metric, which shows the number of active requests being processed by the Contacts.Web resource. When the screen shot was taken, there were no active requests being processed, so the graph is empty. If there were active requests, you would see a line graph showing the number of active requests over time. The screen shot also lists different filters that are available for this metrics, such as http.request.method and url.scheme. These filters are going to vary based on the metric you are viewing. You can use these filters to narrow down the metrics you want to view.
Wrap Up
The Aspire Dashboard is a powerful tool that provides insights into your .NET projects. It allows you to monitor and manage your resources, dependencies, and performance metrics in a single interface. The dashboard is designed to help you quickly identify issues and optimize your development workflow.
References
Share on
Bluesky Facebook LinkedIn Reddit XLike what you read?
Please consider sponsoring this blog.